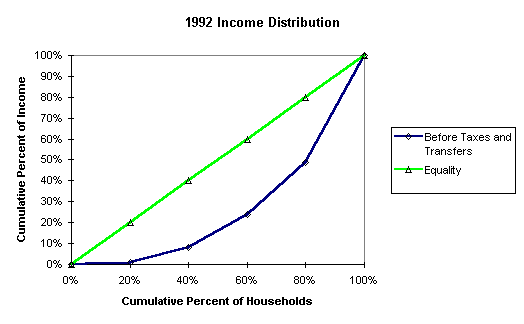
An accumulative graph or Lorenz curve could really also be called a probability curve. This graph here shows the probability of the 1992 income distribution. The green line is representing the equality and the blue curve represents the amount before taxes and transfers. This graph is helping to show the percentage of wealth within the population.
No comments:
Post a Comment